
Backend Reports: Google PageSpeed Insights
The Backend Reports page for Google PageSpeed Insights collects and displays the PSI tests you run from FDP PRO. It helps you compare performance results over time, review the configuration used for each test, and identify trends or regressions.
This page is available at: Freesoul Deactivate Plugins → Testing → Reports.
What this page is for
The Google PSI Reports page is the place where FDP PRO stores and shows the results of your Google PageSpeed Insights tests.
Each report row represents one test run and lets you review:
- The page that was tested
- The theme used for that test
- The plugins disabled during the test
- Whether the test was run for mobile or desktop
- The main PSI performance metrics
- The final performance score
This page is especially useful when you want to compare multiple tests after changing plugin rules in FDP.
How reports are created
Reports are added when you run the Google PSI Test on Mobile or Google PSI Test on Desktop buttons from an FDP row.
They can also be generated through scheduled monitoring when Google PSI monitoring is configured in the testing settings.
Once a test is completed, FDP PRO stores the result and makes it available in the Reports page.
Tool navigation
At the top of the Reports area, you can switch between the available speed tools:
- Google Page Speed Insights
- GTMetrix
When you are on tool=gpsi, the page shows only the reports collected from Google PageSpeed Insights.
Main areas of the page
The Google PSI Reports page is typically made of three main parts:
- The tool selector at the top
- A score chart
- The reports table
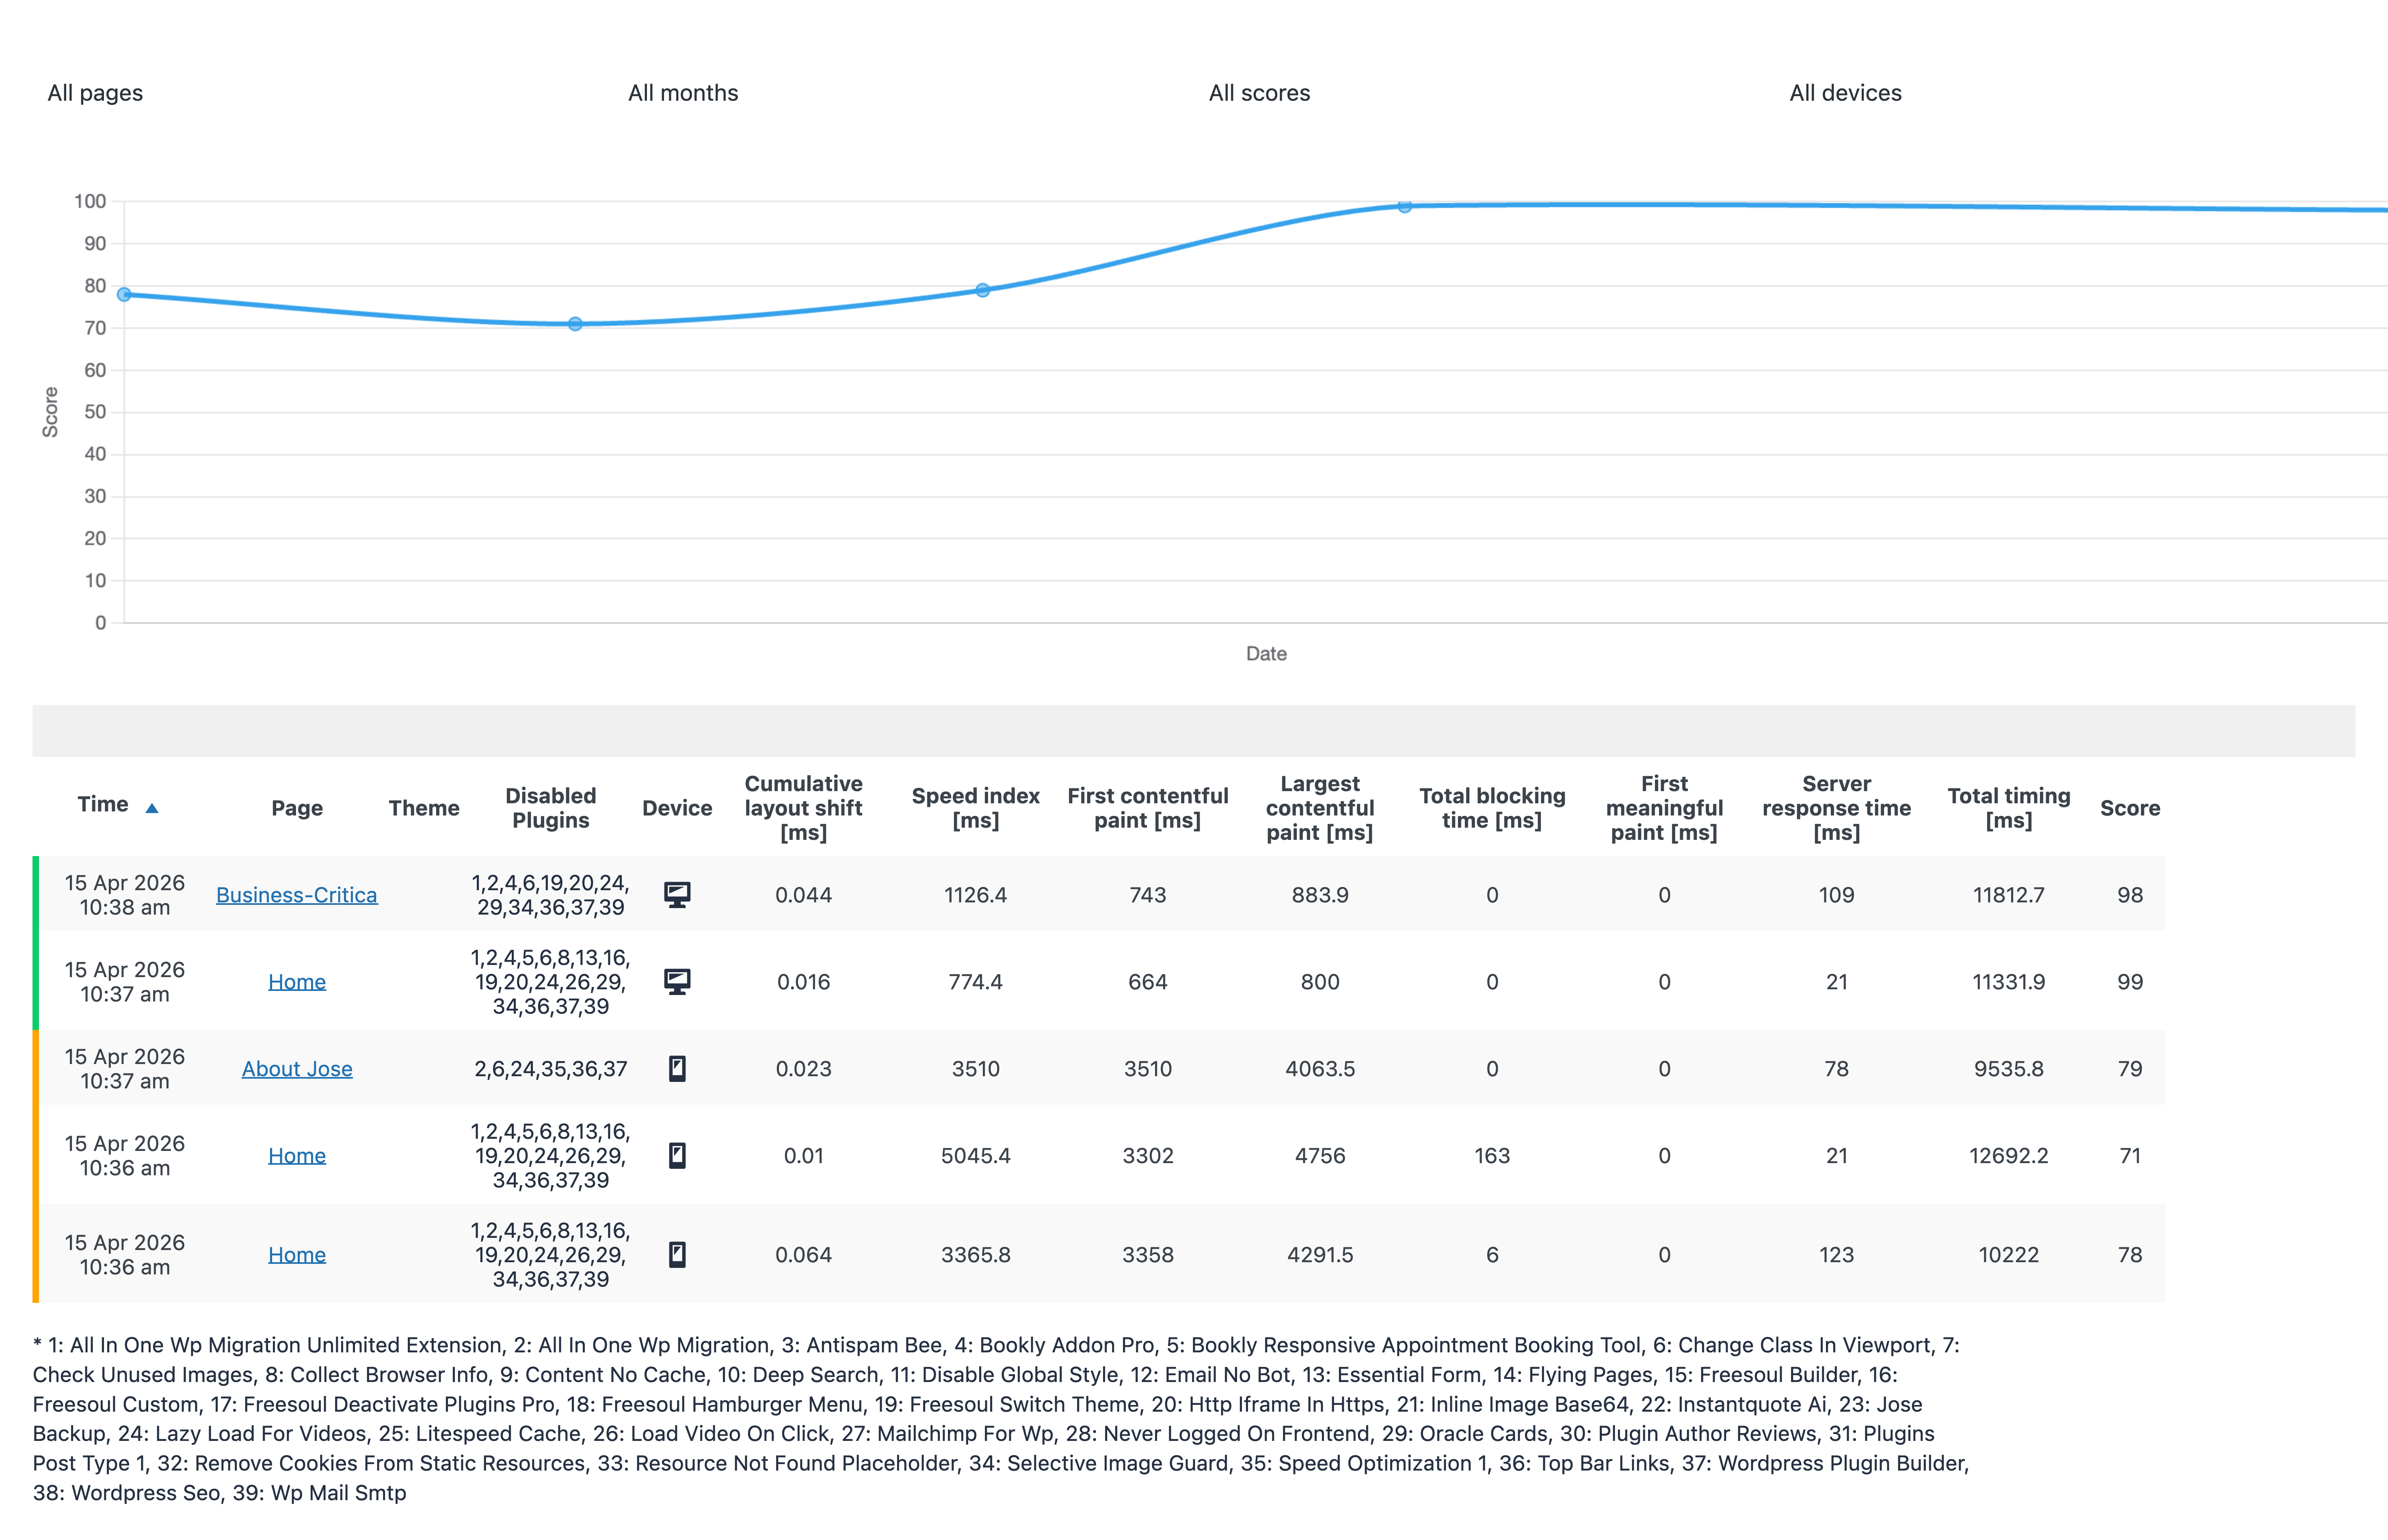
The performance chart
Above the table, FDP PRO displays a chart that plots the score over time for the currently visible report rows.
This chart helps you quickly understand whether performance is improving, staying stable, or getting worse.
If you use the filters, the chart updates automatically to reflect only the visible rows.
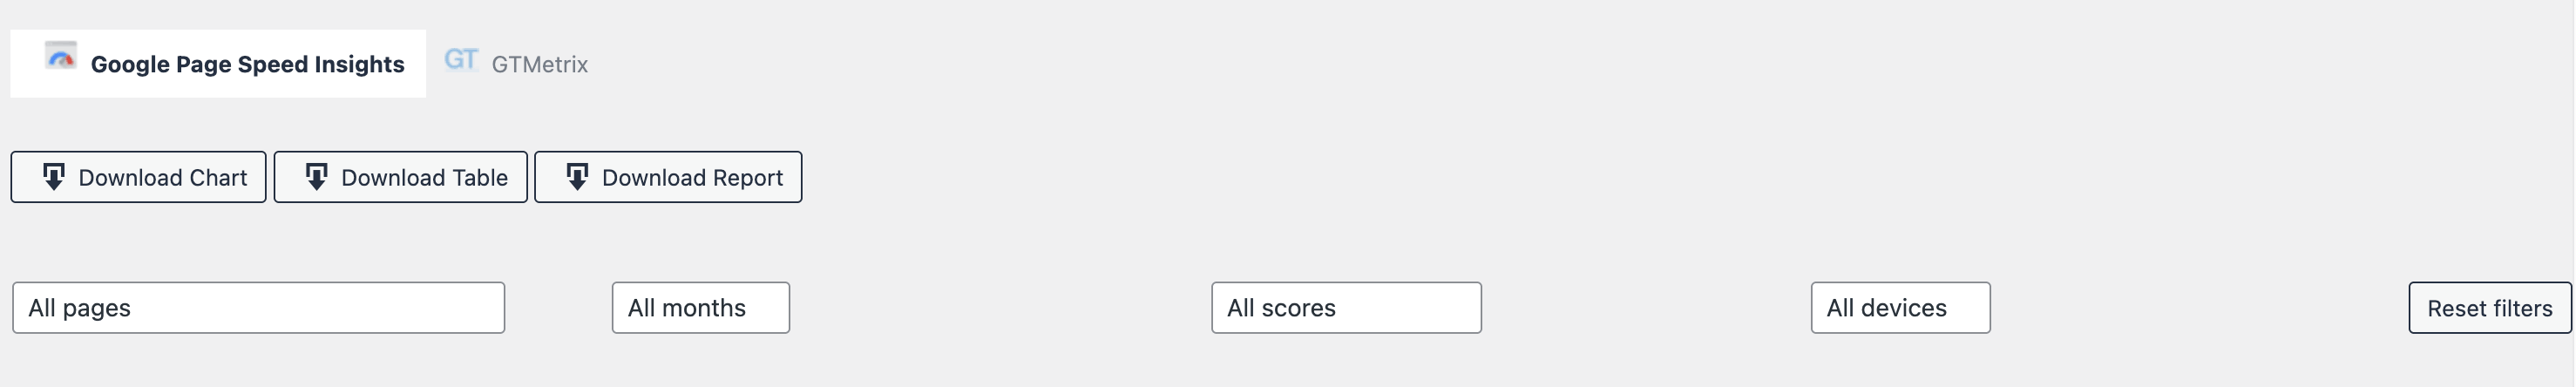
The filters
The page includes a set of filters that help you narrow down the report list.
You can filter by:
- Page
- Month
- Score
- Device
There is also a Reset filters button to clear all filters and show the full report again.
Score filter options
The score filter lets you focus on specific quality ranges, such as:
- Score = 100
- Excellent (90-100)
- Good (70-89)
- Poor (< 70)
This is useful when you want to isolate only the best or worst test results.
What each row shows
Each row in the table represents one Google PSI test result and usually includes:
- Time
- Page
- Theme
- Disabled Plugins
- Device
- Cumulative Layout Shift
- Speed Index
- First Contentful Paint
- Largest Contentful Paint
- Total Blocking Time
- First Meaningful Paint
- Server Response Time
- Total Timing
- Score
Depending on the report data, the page may also include related metadata such as the internal test identifier.
Page column
The Page column shows the tested page name as a link.
Clicking it opens the tested page preview for that report, so you can inspect the version associated with that test.
Disabled Plugins column
The Disabled Plugins column shows which plugins were disabled when the PSI test was run.
If your site has many active plugins, FDP may display a shortened numeric list and show a legend below the table to help you match numbers to plugin names.
This keeps the table easier to read while still preserving the full information.
Device column
The Device column uses icons to indicate whether the result refers to:
- Mobile
- Desktop
This makes it easy to compare mobile and desktop results separately.
Score colors and visual feedback
Rows are visually grouped by score quality, so you can quickly spot strong and weak results.
In general, the score ranges are interpreted as:
- Below 50: low
- 50 to 89: medium
- 90 and above: high
This visual feedback helps you scan the table faster.
Row actions
Each report row can be managed directly from the table.
Available row actions include:
- Delete
- Move
This lets you clean up the report history or reorder rows when needed.
Downloads and export-style actions
At the top of the page, FDP PRO provides quick download actions:
- Download Chart
- Download Table
- Download Report
These options are useful when you want to share results with clients, teammates, or keep a visual snapshot of your testing history.
In practice:
- Download Chart saves the score chart as an image
- Download Table saves the table as an image
- Download Report saves the whole visible report area as an image
How to use this page effectively
A practical workflow is:
- Run a PSI test from an FDP row.
- Open the Reports page.
- Filter the results by page or device.
- Compare the current score with previous tests.
- Review which plugins were disabled for each test.
- Identify the best-performing configuration.
- Keep iterating until you find the right balance between performance and functionality.
Typical use cases
This page is useful when you want to:
- Compare multiple tests for the same page
- Track performance over time
- Separate mobile and desktop analysis
- See whether a plugin change improved or worsened PSI metrics
- Keep a report history of optimization work
Important notes
- The page shows only the tests already stored in FDP PRO.
- If no test has been run yet, the page will show that no reports were found.
- Filters affect both the visible table rows and the chart.
- The quality of the analysis depends on the quality and consistency of the tests you run.
- Mobile and desktop results should always be evaluated separately.
Best practice
When optimizing a page, run several tests over time instead of relying on only one result. Then use the Reports page to compare the score trend, identify the most effective configuration, and document the final outcome.
Example workflow
Suppose you are optimizing a WooCommerce product page.
You may:
- Run a Google PSI Test on Mobile with the current plugin setup.
- Disable some non-essential plugins in the FDP row.
- Run the mobile test again.
- Open the Reports page and filter by that page.
- Compare both scores and metrics.
- Repeat the process for desktop.
- Keep the configuration that improves performance without breaking functionality.