
Profile a Row with the Code Profiler Button
Use the Code Profiler button in Freesoul Deactivate Plugins to run a performance profile for a specific row and immediately see which plugins are the heaviest for that exact configuration.
This feature is designed to help you answer a practical question very quickly:
“If I load this page with the plugins enabled or disabled exactly as shown in this row, which plugins consume the most execution time?”
Requirements
The profiling button is available only when all of the following conditions are met:
- Code Profiler or Code Profiler Pro is installed and active.
- Freesoul Deactivate Plugins PRO is active.
- You are a super admin.
- The current row has a usable preview URL.
If one of these conditions is missing, the button will not appear.
Where You Will Find the Button
Open one of the FDP matrix pages where rows represent a page, archive, backend page, or similar target.
Then:
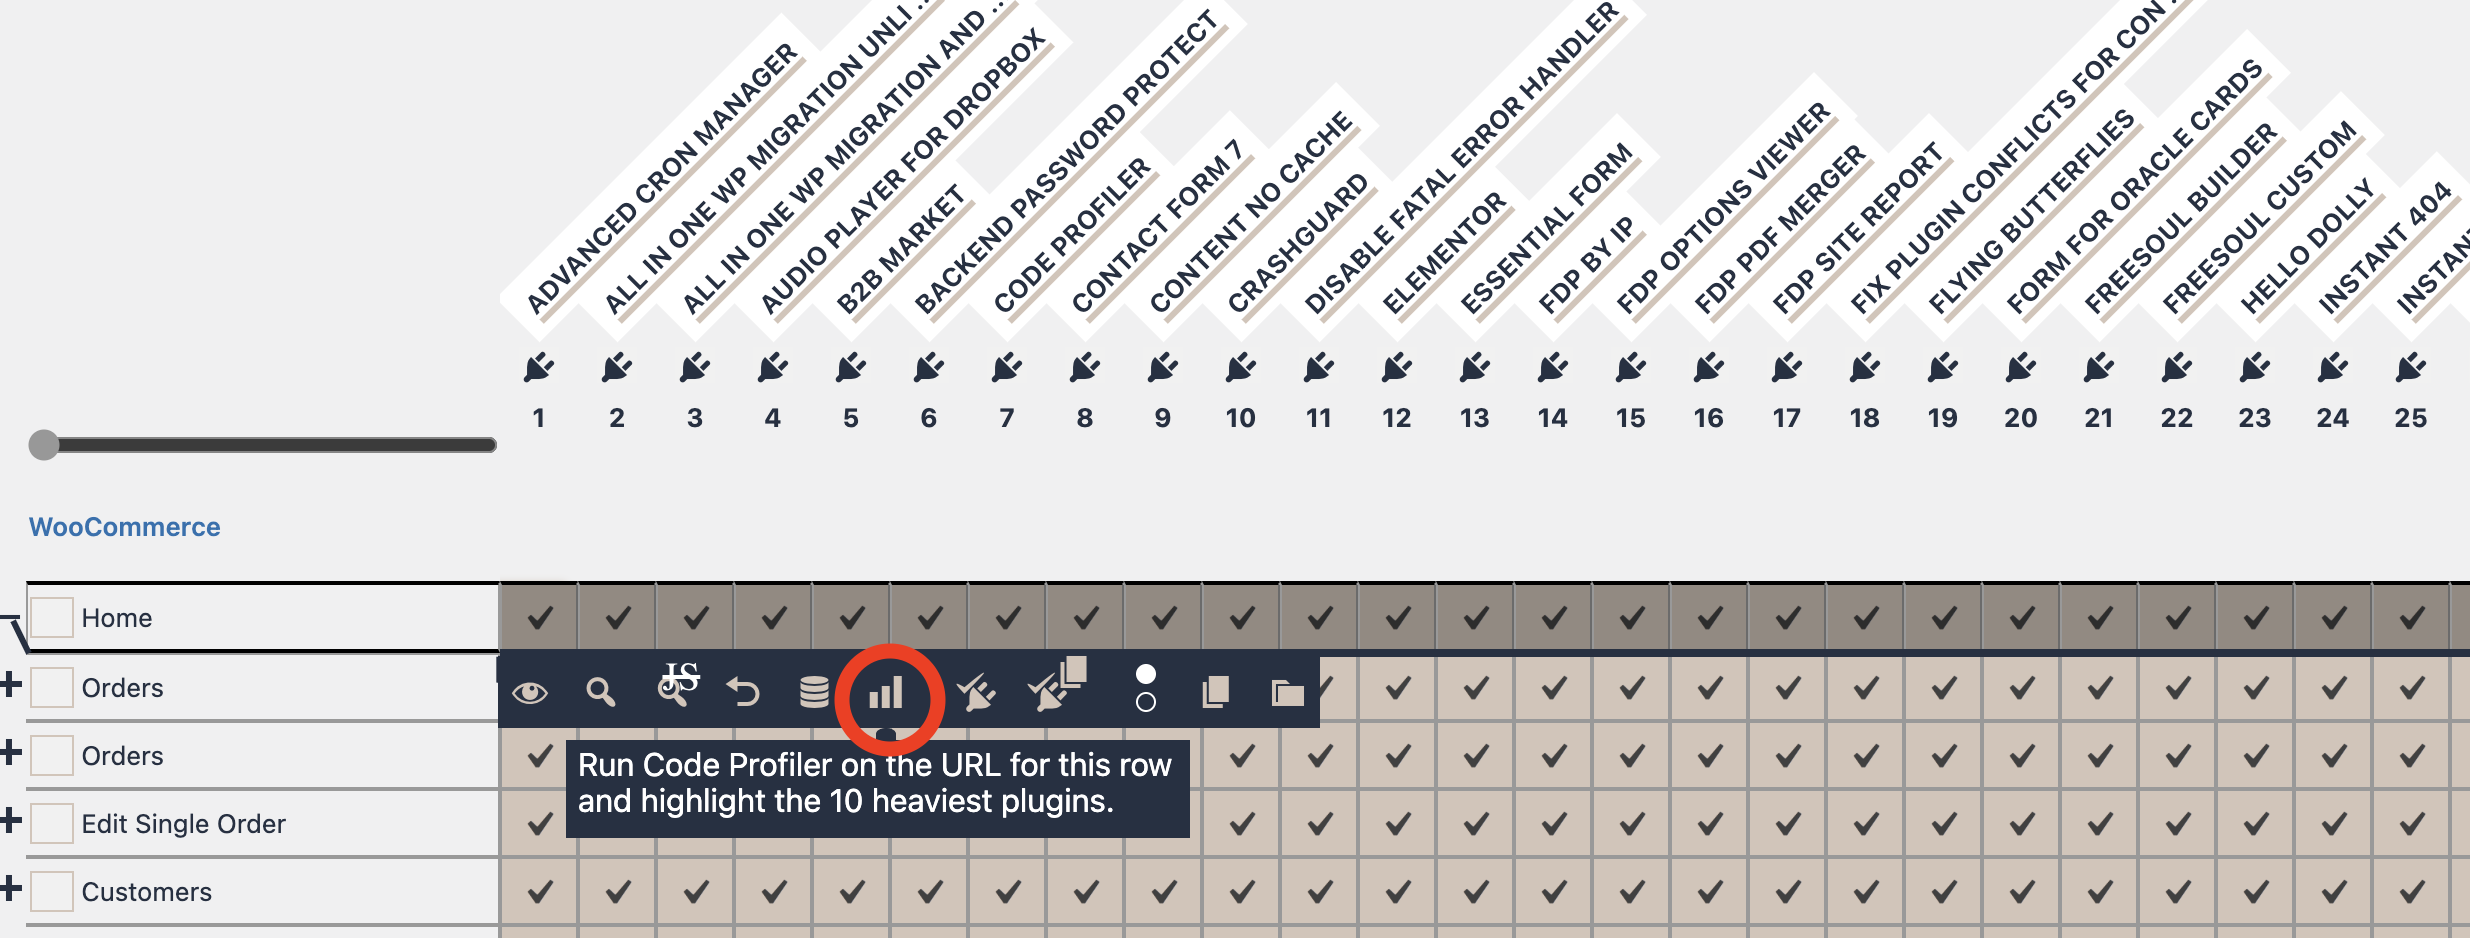
- Open the row action bar by clicking the plus icon.
- Look for the bar chart icon in the row actions.
- Hover the icon to see the tooltip.
The tooltip says that FDP will run Code Profiler on the URL for that row and highlight the 10 heaviest plugins.
What the Button Does
When you click the profiling button, FDP does not run a generic global profile.
Instead, it prepares a profile for the exact row you clicked.
That means FDP first builds the request using the row’s current settings, then asks Code Profiler to profile that request.
Depending on the row type, FDP uses the correct preview context:
- frontend single rows use the row preview URL
- archive and term archive rows use their preview context
- backend rows use the backend page URL
- backend profiles are run as authenticated requests
- frontend profiles are run as unauthenticated requests unless the row requires a different context from the preview flow
After the profile is created, FDP reads the result and extracts the heaviest plugins.
What Happens After Clicking
The sequence is:
- FDP prepares the preview for that row.
- FDP starts a Code Profiler run for the prepared URL.
- FDP waits for Code Profiler to generate the report.
- FDP reads the profile results.
- FDP highlights the top 10 heaviest plugins in the table.
- FDP opens a popup with the ranked list and a link to the full profile.
While the process is running, you will see inline status messages such as:
- Preparing preview…
- Profiling…
If the process succeeds, the button becomes visually active and the results are shown.
How to Read the Results
After a successful run, FDP highlights the heaviest plugins directly in the matrix.
You will see:
- highlighted plugin headers at the top of the table
- highlighted cells in the current row
- a ranking badge on each highlighted plugin
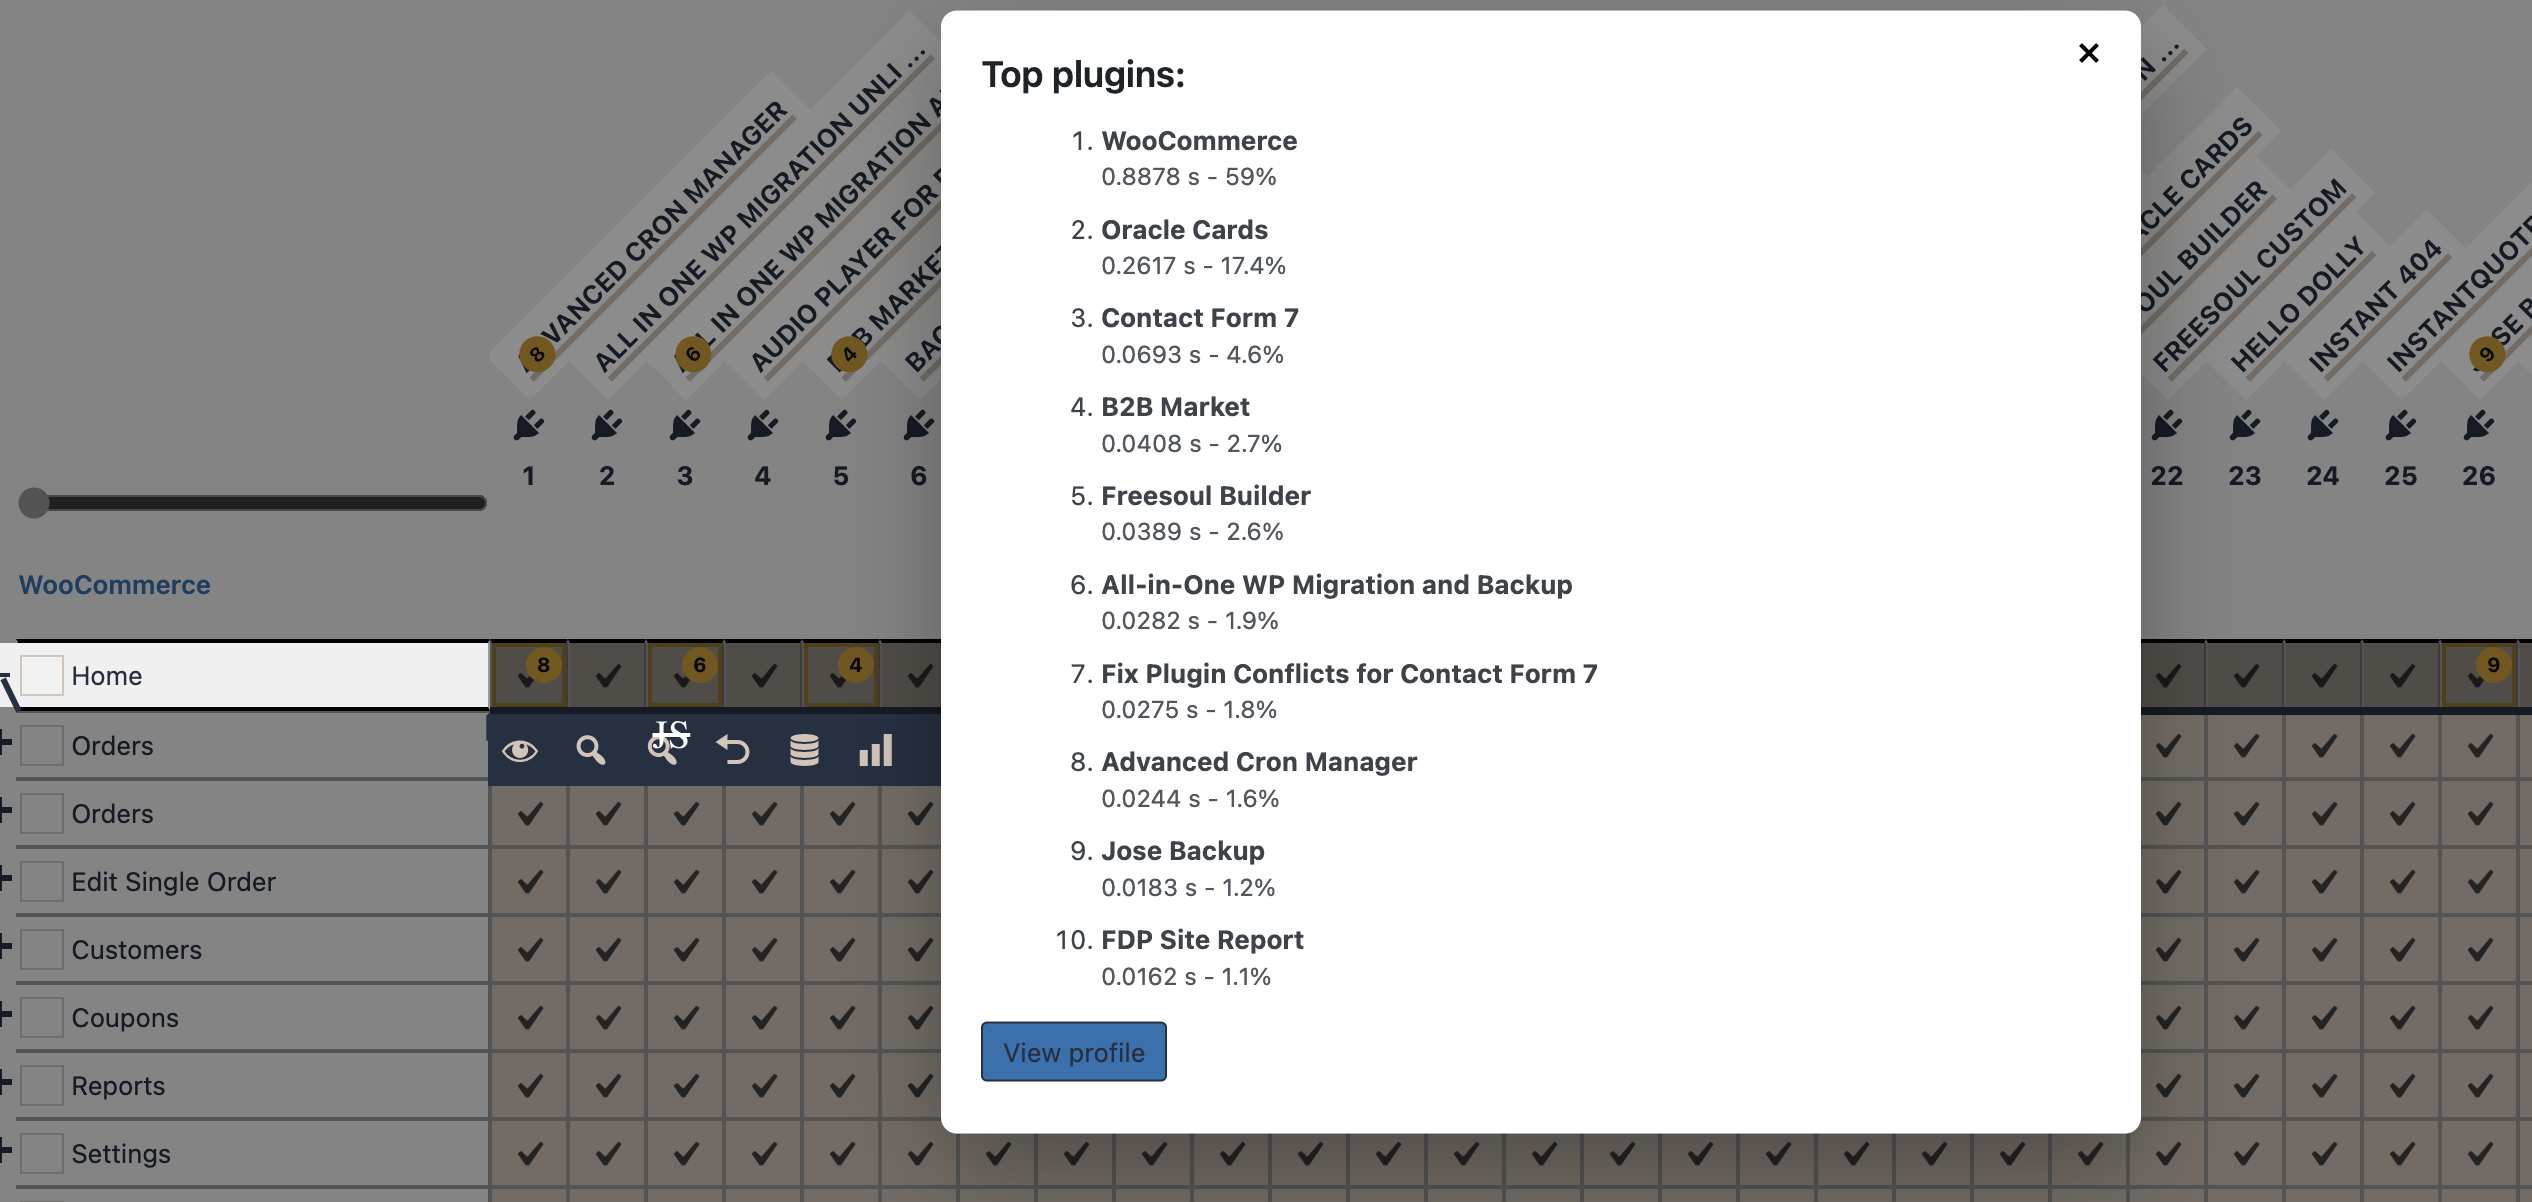
- a popup showing the ordered list of the heaviest plugins
- a View profile button linking to the full Code Profiler report
Each highlighted item includes:
- plugin name
- execution time in seconds
- percentage of the total plugin and theme execution time
- ranking position
This makes it easy to see both the detailed Code Profiler report and the same information mapped back onto the FDP row you are editing.
What “Top 10 Heaviest Plugins” Means
FDP reads the generated Code Profiler profile and retrieves the top plugins from the profiling report.
The highlighted plugins are the ones with the highest execution cost in that profile.
In other words, the highlighted list is not based on plugin size, number of files, or memory usage alone. It is based on the timing data from the generated profile.
How FDP Decides Which Plugins Are Active During Profiling
FDP supports two profiling modes for Code Profiler.
You can configure them in the hidden FDP Code Profiler page:
FDP > Code Profiler
On that page, you can choose one of these options:
1. According to the FDP row settings
In this mode, the profile respects the exact FDP configuration of the row you are profiling.
This is the most useful mode when you want to test the real impact of the plugin combination you are building inside FDP.
Use this mode when your goal is:
- testing the actual row configuration
- comparing different FDP row setups
- finding the heaviest plugins among the plugins that remain active for that row
2. According to the Code Profiler → Plugins settings page
In this mode, Code Profiler uses the plugin list configured in the Code Profiler – Plugins page instead of the current FDP row settings.
This is useful when you want a fixed profiling baseline independent of the row.
Use this mode when your goal is:
- reusing the same profiling plugin set across multiple tests
- comparing rows against a stable Code Profiler configuration
- excluding or including specific plugins manually for all Code Profiler runs
This mode can only be used on Code Profiler backend pages.
On FDP settings pages, the first method is applied.
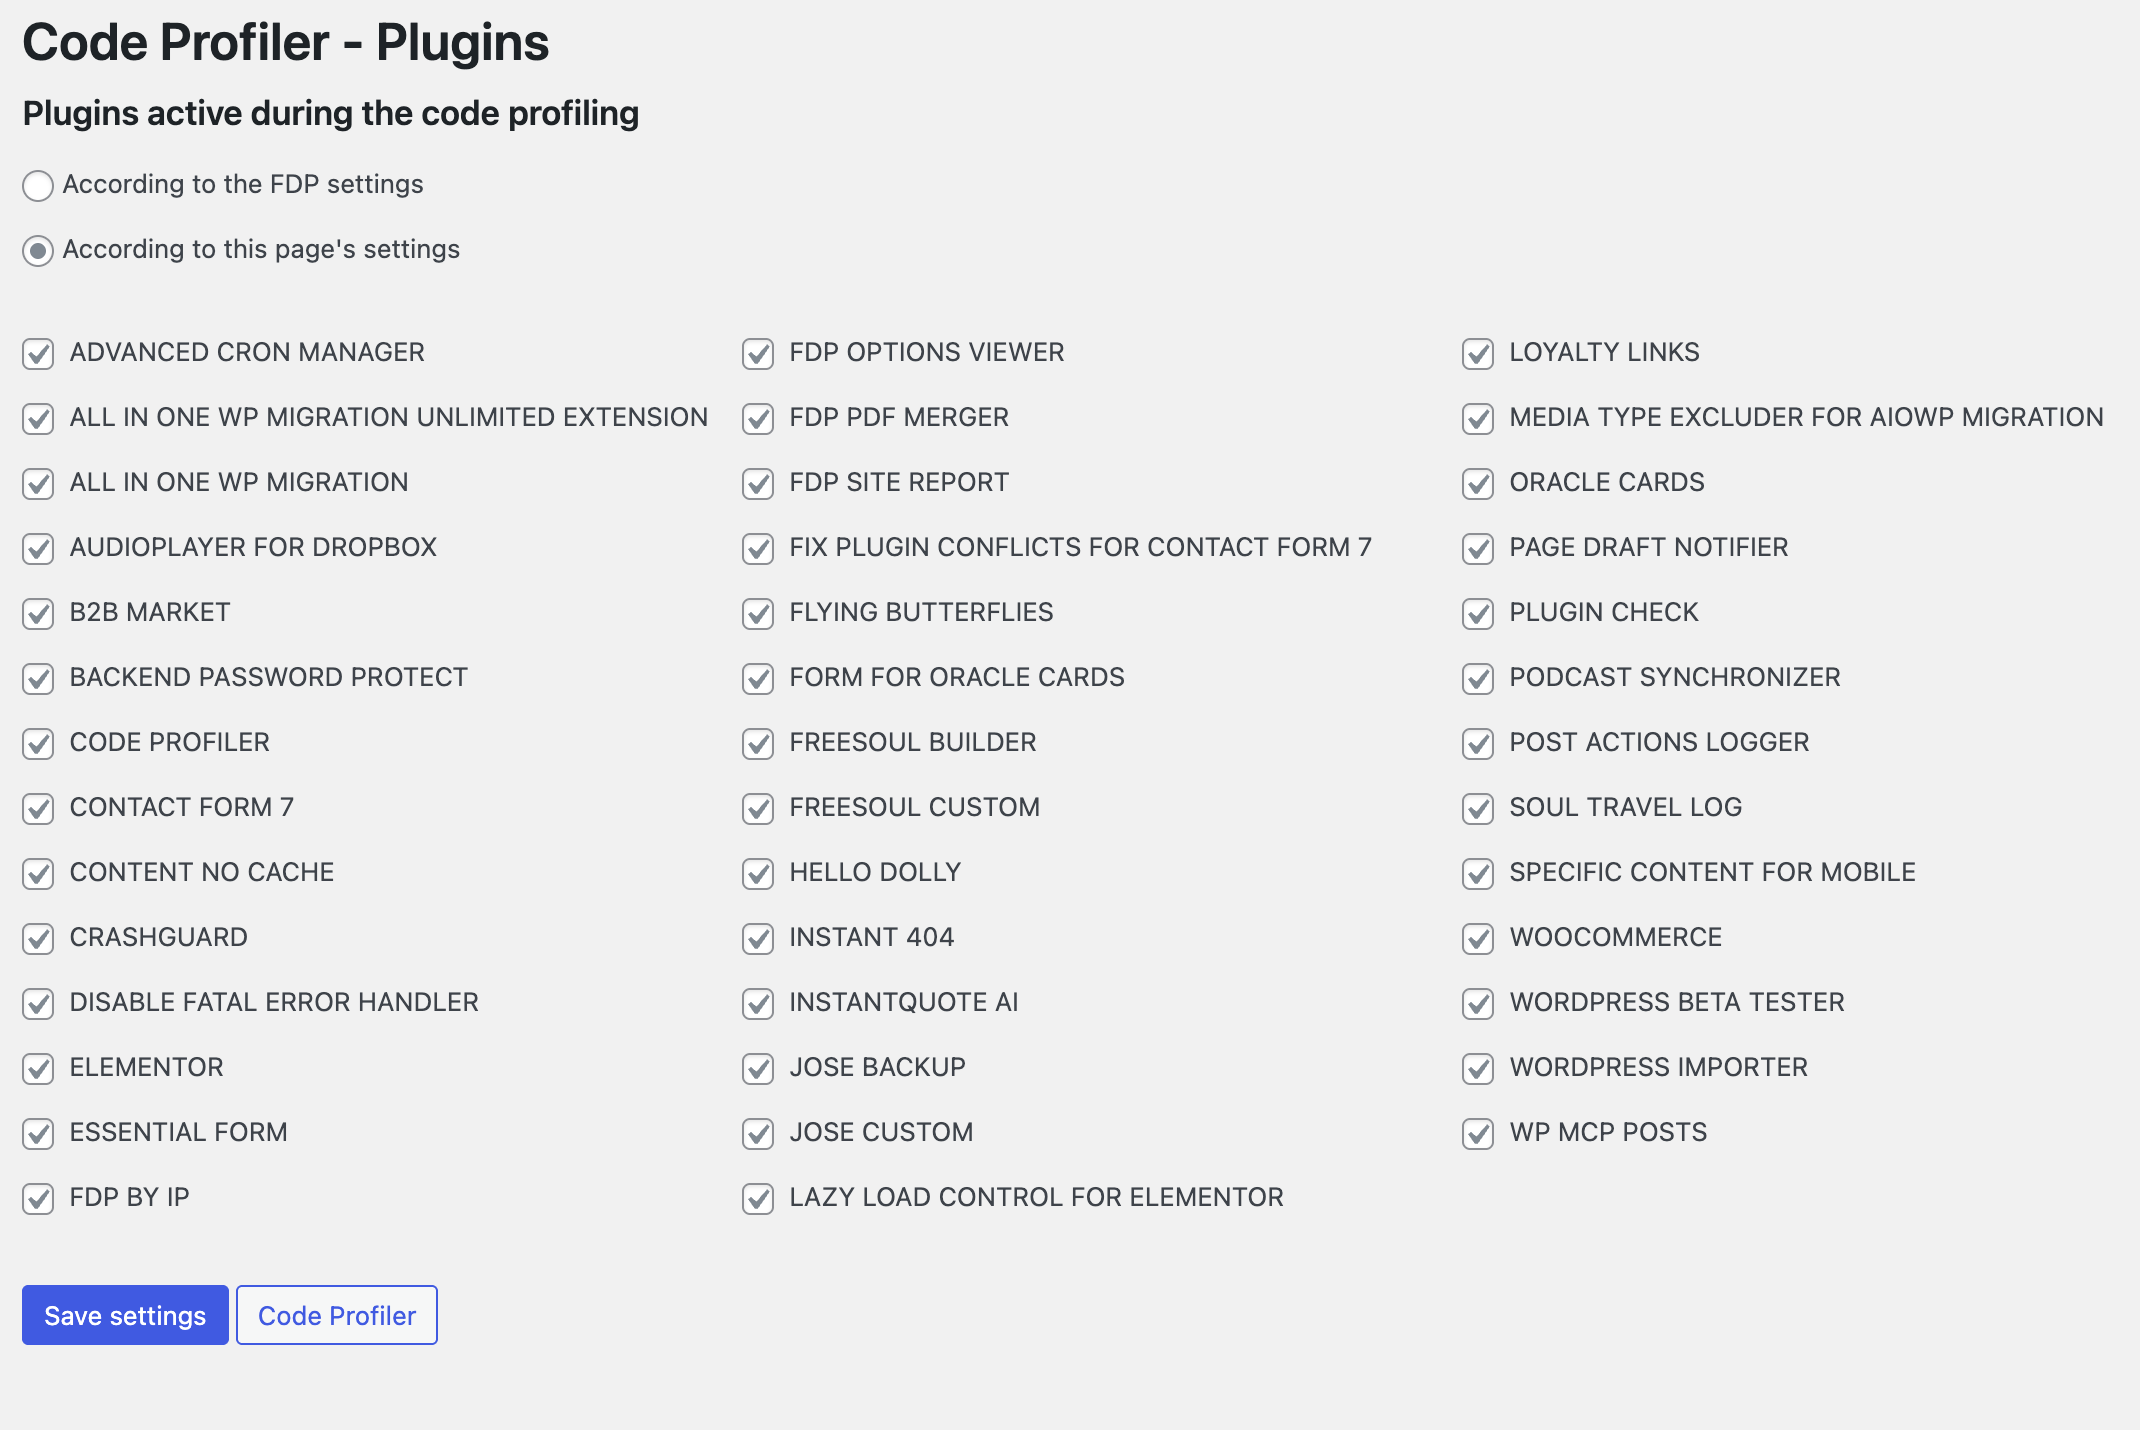
The Code Profiler – Plugins Settings Page
The Code Profiler – Plugins page lets you decide which plugins should remain active during profiling when the second mode is selected.
On that page:
- checked plugins stay active during profiling
- unchecked plugins are disabled during profiling
- you can save the configuration with Save settings
- you can open the main Code Profiler screen from the same page
Important note:
the Code Profiler plugin itself is not treated like a normal plugin to disable from the row profiling flow, because it must remain available to generate the report correctly
Frontend vs Backend Profiling
Frontend rows
For frontend rows, FDP profiles the preview URL built from the row settings.
This lets you test:
- singles
- archives
- term archives
- other row types that expose a preview URL
Backend rows
For backend rows, FDP profiles the backend page URL represented by the row.
In this case FDP marks the request as backend usage and runs it as an authenticated request.
This is useful when you want to understand which plugins are the heaviest on specific admin pages.
Typical Workflow
- Open the FDP page that contains the row you want to optimize.
- Configure the row by enabling or disabling plugins.
- Open the row action bar.
- Click the Code Profiler button.
- Wait for the popup and highlights.
- Review the top 10 heaviest plugins.
- Adjust the row if needed.
- Run the profiler again to compare the result.
This is especially useful when you are not sure whether a plugin is just active or actually expensive.
When the Button Is Hidden
The profiling button stays hidden when FDP cannot find a valid preview target for the row.
So if you do not see it, the most common reasons are:
- Code Profiler is not active
- FDP PRO is not active
- you are not a super admin
- the current row does not expose a preview URL
- the action bar was not opened for that row
Error Messages You May See
- No preview URL is available for this row.
- The profiling request failed.
- The profile was created, but FDP could not read the results.
- No plugin data found in the generated profile.
In these cases, the row is not changed. FDP simply reports that the profiling process could not complete normally.
Best Practices
- Run the profiler after you have configured a row, not before.
- Compare two row configurations by profiling them one after the other.
- Use the According to the FDP settings mode when your goal is to optimize the real FDP behavior.
- Use the According to this page’s settings mode when you want a stable benchmark across tests.
- Review the highlighted plugins before disabling anything else. A plugin being active does not necessarily mean it is one of the expensive ones.
- Open the full profile when you need more detail than the popup summary.
Summary
The Code Profiler button in FDP is a row-based performance analysis tool.
It lets you:
- profile the exact URL represented by a row
- use the exact FDP settings for that row, or a dedicated profiling configuration
- highlight the 10 heaviest plugins directly inside the matrix
- open the full Code Profiler report for deeper investigation
It is the fastest way to connect FDP configuration decisions with real profiling data.